It’s Monday morning, just before 8 a.m. In a large office building in the city center, the facility manager is starting his day. With a single click, he opens the CAFM software on his laptop. What he sees is not a wall of numbers and spreadsheets, but a dynamic digital building map where everything is in motion: rooms glow in different colors, a warning symbol flashes in the server room, and one meeting room shows an unusually high temperature.
What appears on the screen is much more than a technical tool. It’s a visual interface to reality—providing the foundation for fast, well-informed decisions.
The Power of Visualization
Facility management today is no longer just about tools and maintenance plans. Running properties efficiently now requires real-time insights—in the most literal sense. That’s why modern CAFM (Computer-Aided Facility Management) systems increasingly rely on advanced visualization features that make floor plans, building conditions, and processes instantly visible.
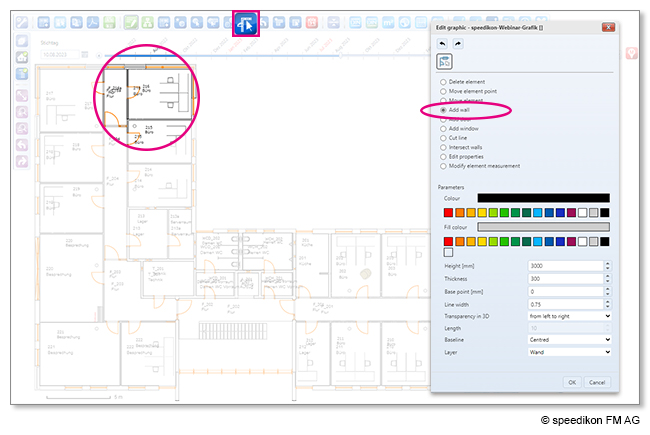
CAD drawings (DWG, DGN, and others) can be imported directly into the system, allowing space layouts, technical installations, and other details to be updated and edited digitally. What used to sit in a filing cabinet is now dynamic and always accessible—whether for planning a move or preparing a maintenance task.
Colors, Spaces, Actions
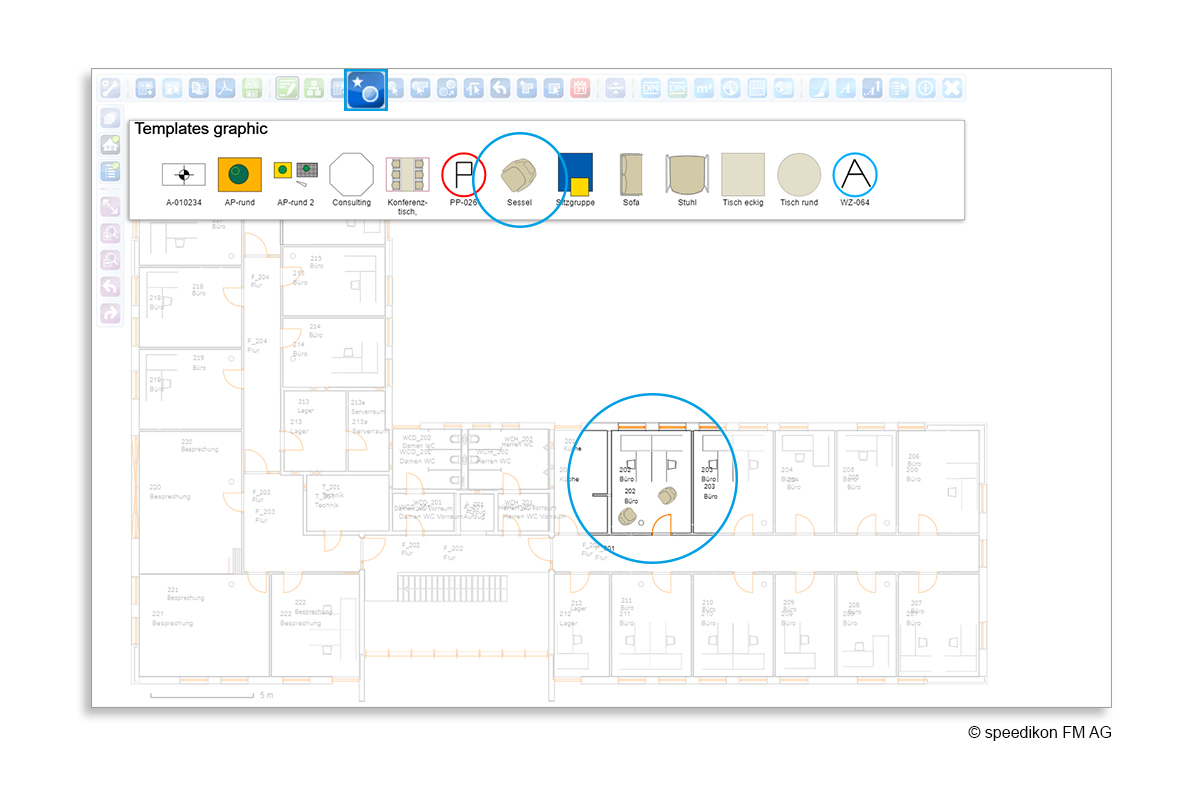
One standout feature is graphical space management. The software automatically detects room boundaries, categorizes spaces, and color-codes them based on usage type or cleaning frequency. For facility managers, this means they can instantly see where action is needed—whether for cleaning, remodeling, or space reallocation.
Zoning tools also help with strategic planning: How efficiently is the building being used? Where is there available capacity? Which areas generate the highest operating costs? The answers no longer require laborious spreadsheet analysis—they’re displayed clearly through color-coded visualizations.
Data That Tells a Story
Visualization becomes even more powerful when combined with real-time data. Many CAFM systems today offer interactive dashboards that integrate live sensor data and maintenance updates directly with the building plan.
This allows facility teams to identify overdue inspections, faults, or abnormal energy consumption—and pinpoint them on the map.
The result? Issues can be resolved faster, resources can be planned more effectively, and processes become more transparent—for both the onsite team and senior management.
Seeing Is Deciding
The graphical features of modern CAFM software are far more than a nice-to-have. They make complex relationships intuitive, connect technical data with spatial awareness, and enable a faster, more transparent, and more effective approach to facility management.
Images: speedikon FM AG