In times of rising energy prices, increasing regulatory requirements and ambitious sustainability targets, precise, transparent and adaptive energy monitoring is essential. WiriTec C addresses these requirements with a range of new dashboard functionalities that significantly improve both data visualisation and operational handling.
Traffic light logic for intuitive consumption indicators
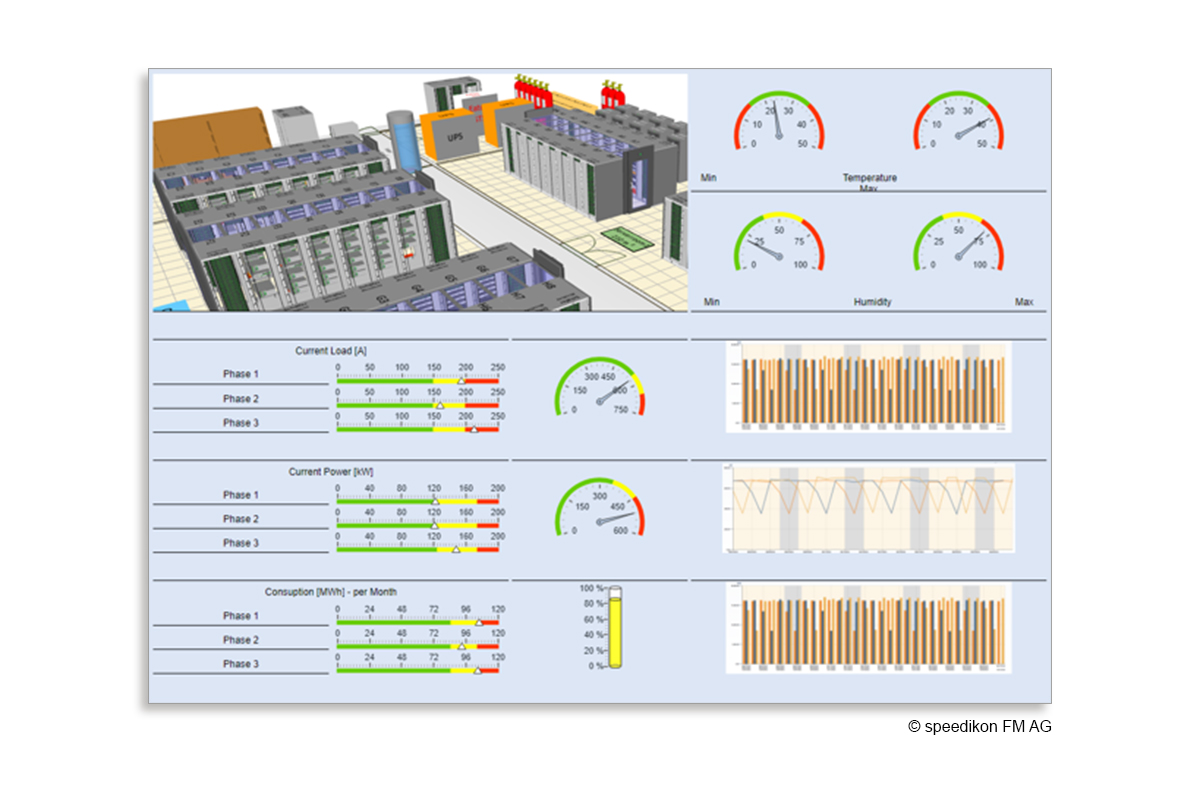
A central feature of the energy management solution is the introduction of configurable traffic light graphics. These can be customised with one, two or three light fields and linked to specific consumption limit values. For example, a red signal can be triggered automatically if a defined threshold value is exceeded – ideal for directly recognising critical states in energy consumption. The traffic light components can be seamlessly integrated into existing dashboards and are fully customisable – including the colour of the housing.
Flexibly combine time dimensions
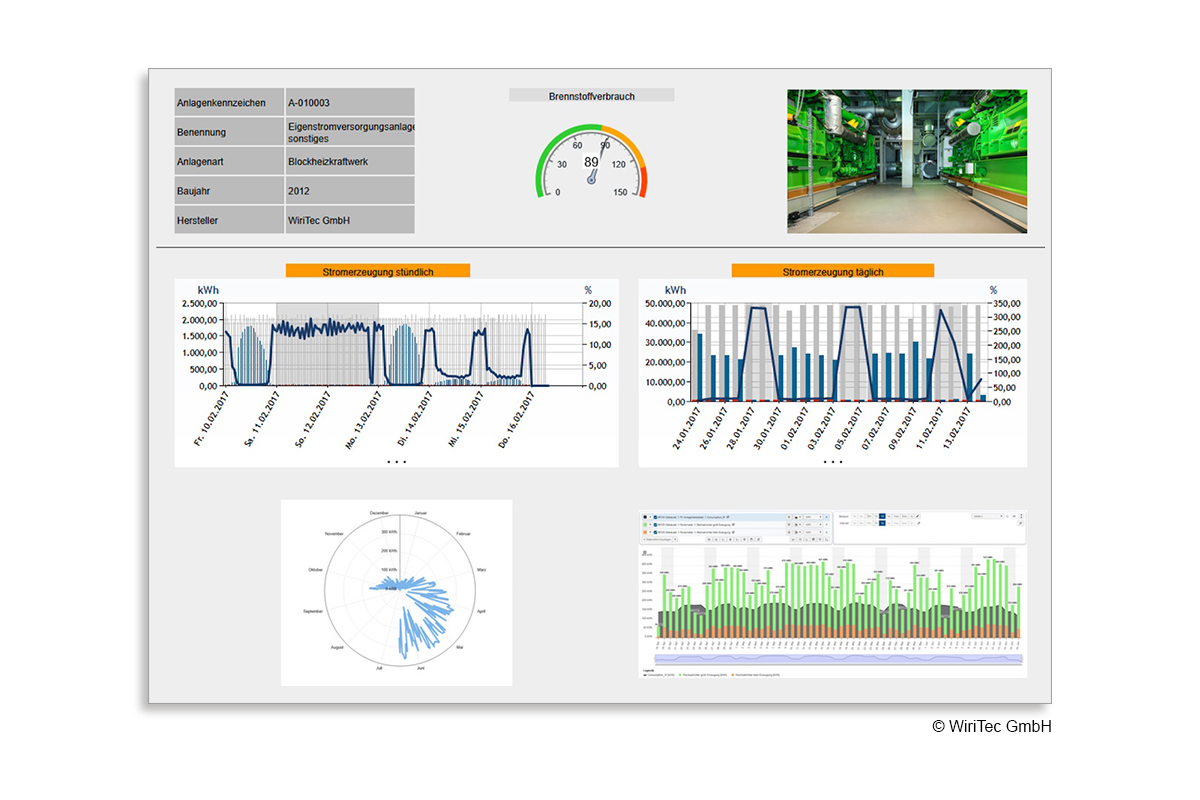
Another highlight is the ability to display several time periods in parallel in one dashboard. For example, current consumption values and monthly averages can be visualised simultaneously in a round instrument.
The time selection can be configured for specific charts. This enables a differentiated analysis within a single dashboard, for example to compare daily and weekly values.
Timestamps show timeliness
WiriTec C has a timestamp function to ensure that data integrity is always guaranteed. It shows the time of the last successful data transfer. This enables transmission problems to be identified quickly and increases operational reliability. The transmission frequency can be set flexibly – a 15-minute cycle would be standard.
Optimised dashboard for power users
Power users who work very intensively with the software are supported by the simplified configuration of the dashboards: pages and columns can be added, moved or rearranged simply and intuitively using drag-and-drop. The order of the pages can also be adjusted with just a few clicks – a clear advantage for users who regularly work with complex visualisations.
Enhanced usability through media integration
Another supporting element is the integration of images and logos for user guidance. They can be used to label company areas, for example. The illustration option also helps users who are not active in the application on a daily basis and shortens the familiarisation time for new user groups.
IFrame integrates live data
The new IFrame function has been developed to integrate charts with live data directly into a roof board. It opens up new possibilities for real-time visualisation – such as the integration of SCADA systems, weather data or external energy price indicators.
Transparency and speed
In addition to functional enhancements, the new features in WiriTec C also significantly improve operational efficiency in energy monitoring. The new dashboards enable
– more precise analyses,
– faster response times and
– user-friendly visualisation of complex consumption data.
They are a decisive step towards greater speed and transparency in order to realise sustainable energy efficiency in the company.
Picture: WiriTec GmbH