Many companies today face the challenge of meeting an increasing number of reporting and documentation requirements, particularly with regard to ESG (Environmental, Social, Governance), supply chain responsibility and legal regulations. For ESG reports, for example, specific data must be collected, including energy consumption, CO₂ emissions, details on water and waste management as well as information on social criteria and operational management such as occupational safety or ethical procurement processes. Although much of this data is already available in the company, it is often scattered in isolated systems such as billing tools, process control systems or field sensors and is available in an inhomogeneous form. This fragmentation poses a challenge for consistent evaluation and preparation for annual reports, such as an ESG report.
Integrating fragmented data landscapes
How does software manage to efficiently consolidate and structure energy data management (EDM) based on heterogeneous data sources? In the first step, the software collects data from various process and control systems or directly via field protocols, such as OPC, Modbus or BACnet, and makes it available on a central platform. This ensures that all relevant information – such as energy consumption, use of air conditioning systems or production performance – can be taken into account in reports and analyses.
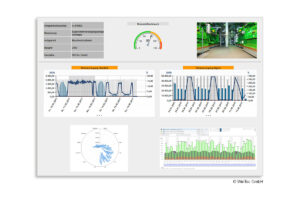
It is advantageous if the software can analyze the supplied data in near real time and generate reports at the touch of a button. If standard forms and tools are stored in the application, companies can easily access informative dashboards for high-level aggregations or complex reporting, but can also carry out detailed and in-depth analyses independently.
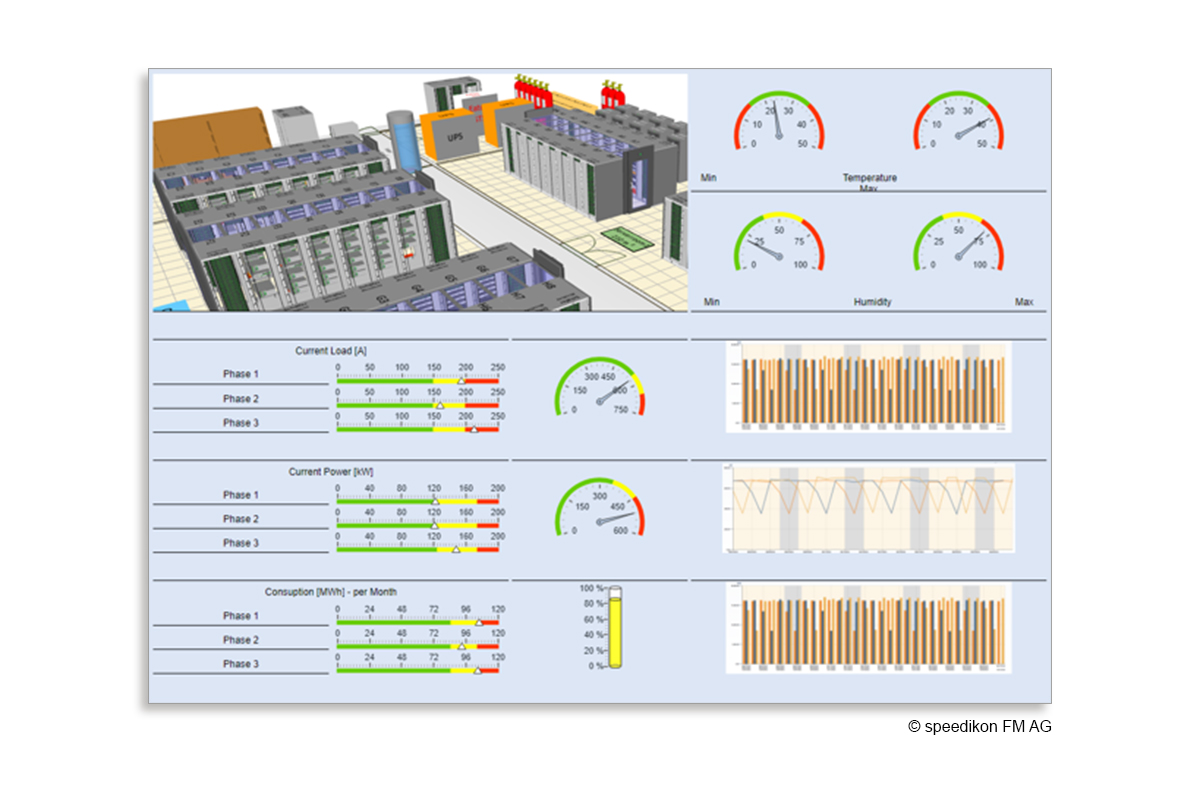
Today, it is standard for energy management software to read out and aggregate the energy consumption data of a system, for example a heating, ventilation or air conditioning system, every quarter of an hour. For example, the annual consumption total can be calculated with a single click, a key figure that is of crucial importance in the final report. It is also possible to visualize current energy consumption data on a large scale and generate specific metrics such as CO₂ emissions per area or employee – at any time.
Plausibility checks and quality assurance
Particularly advanced applications continuously monitor incoming data. Plausibility checks and data quality control detect errors and discrepancies at an early stage. This means that, on the one hand, information can be sent to the responsible personnel and, on the other hand, reports with incorrect data can be avoided and all decisions can be made on a solid data basis. Such proactive error detection not only saves time and costs, but also improves the quality of reporting.
Optimization of the energy infrastructure
The reports generated by the software not only provide transparency, but also support strategic planning and optimization, particularly with regard to ESG requirements. This is because if companies can identify consumption peaks or average loads, they can easily optimize the design and control of systems such as heating, ventilation and air conditioning systems.
Economic and environmental benefits
Advanced energy management software delivers clear added value in terms of economic efficiency and environmental sustainability. Companies that understand and optimize their energy data benefit both in terms of significant savings in consumption and improved system performance, as well as ecologically. This gives them a decisive competitive advantage.
Picture: everythingpossible /Freepik.com